
Classic Web Entry
Enter rangeland data directly through our web interface with full control and flexibility.
- Browser-based access
- Full editing capability
- Upload photos from device
- Generate reports immediately
Select the approach that works best for your workflow
Enter rangeland data directly through our web interface with full control and flexibility.
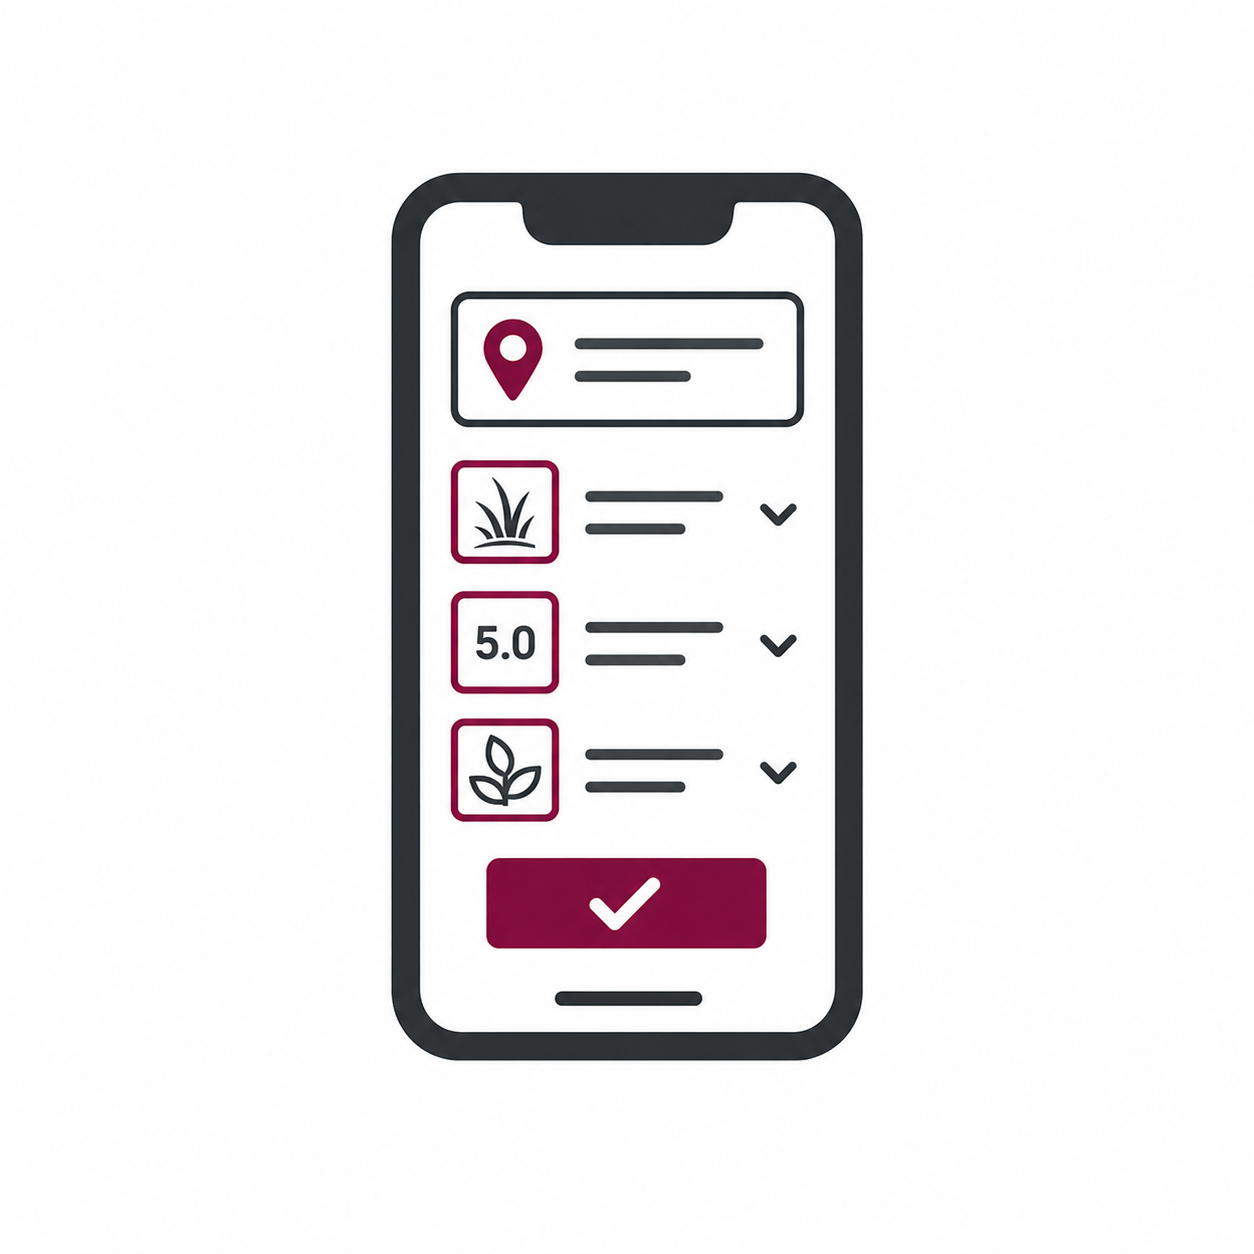
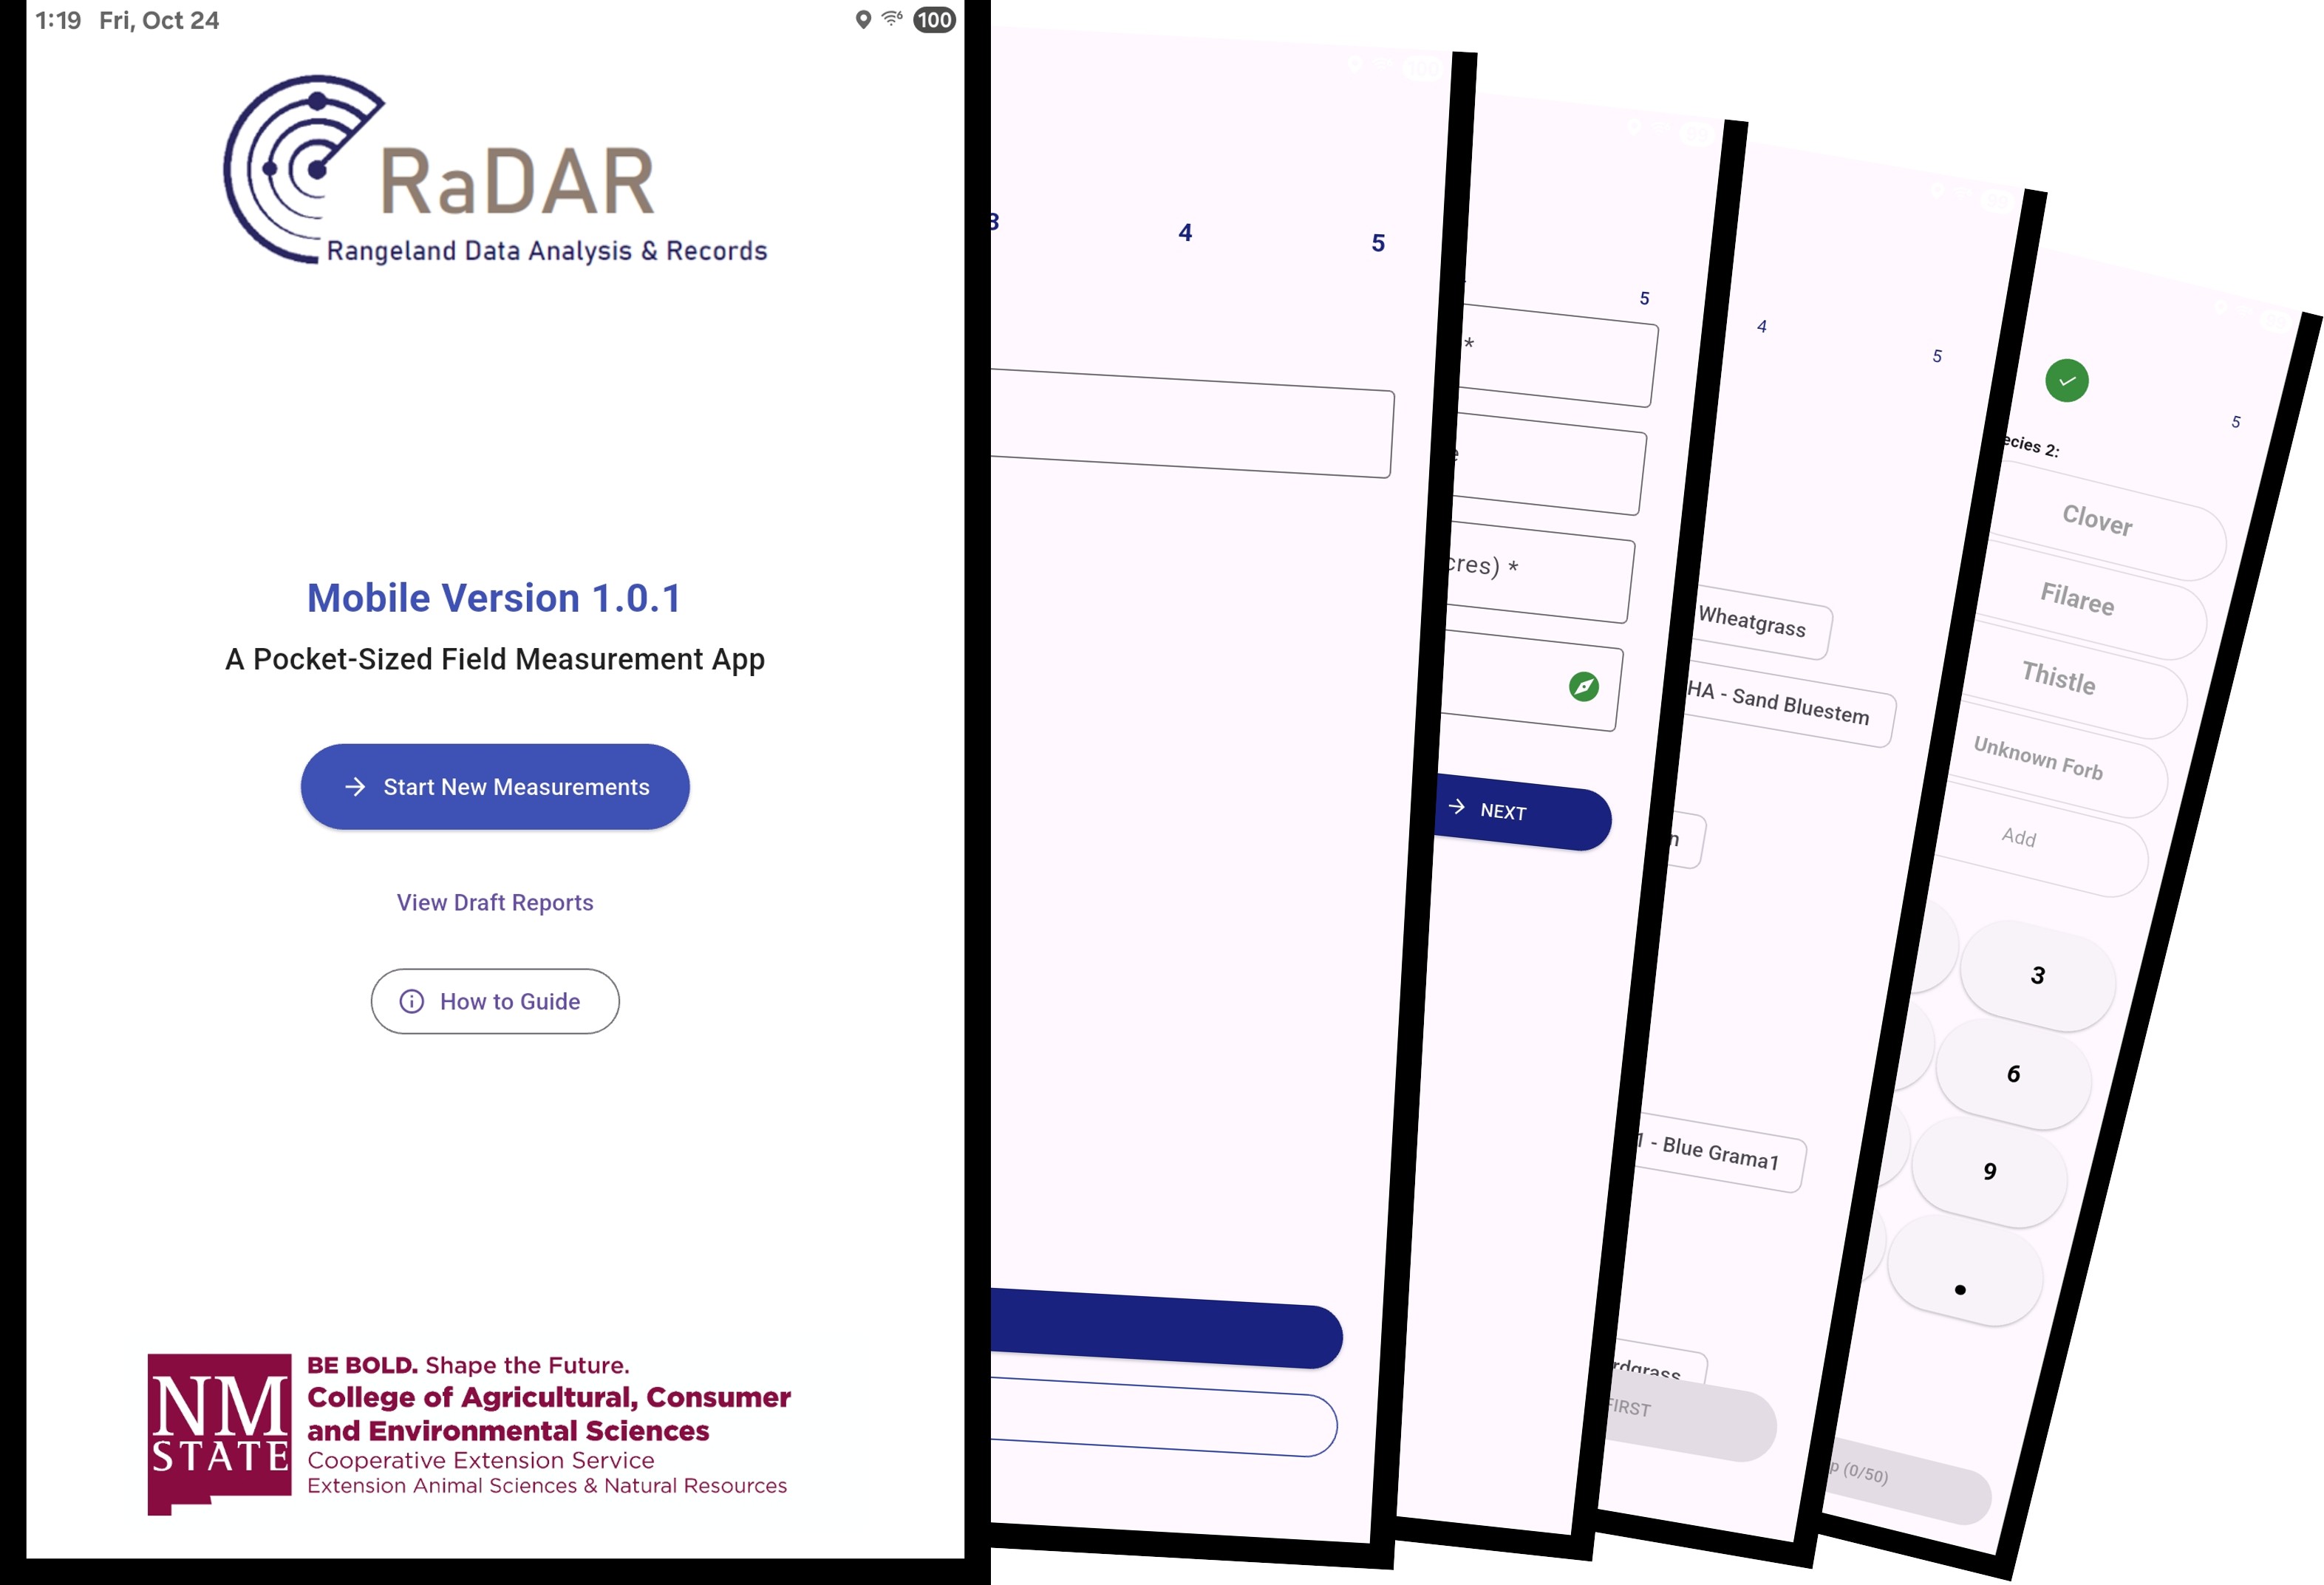
Capture field data on-site with our mobile app. Eliminates duplicate data entry.
Collect
Field Data

Upload
Draft

Generate
Report
Review on
Website
Collect rangeland data efficiently with RaDAR Mobile
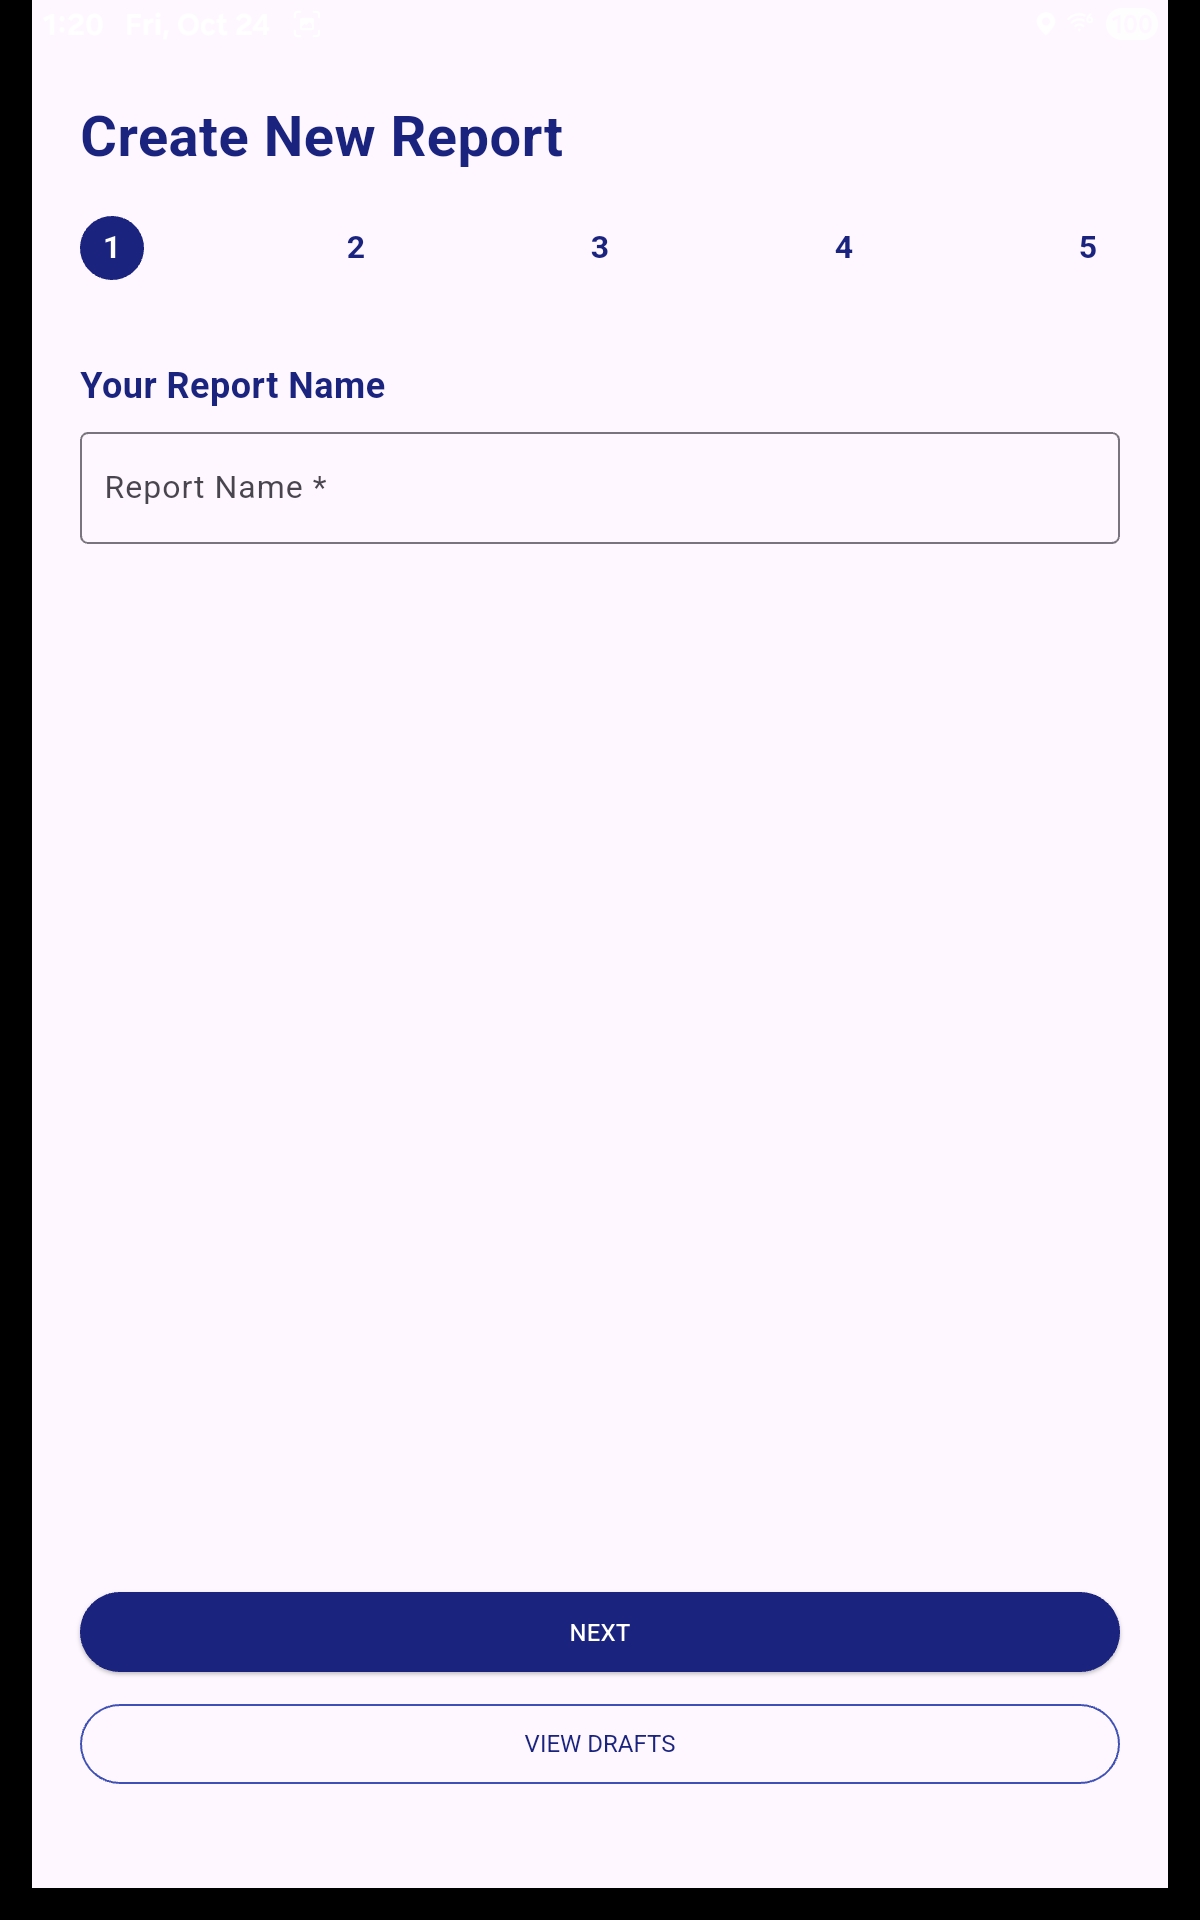
Enter a unique name that will help easily identify the report in Reports Listing Page.
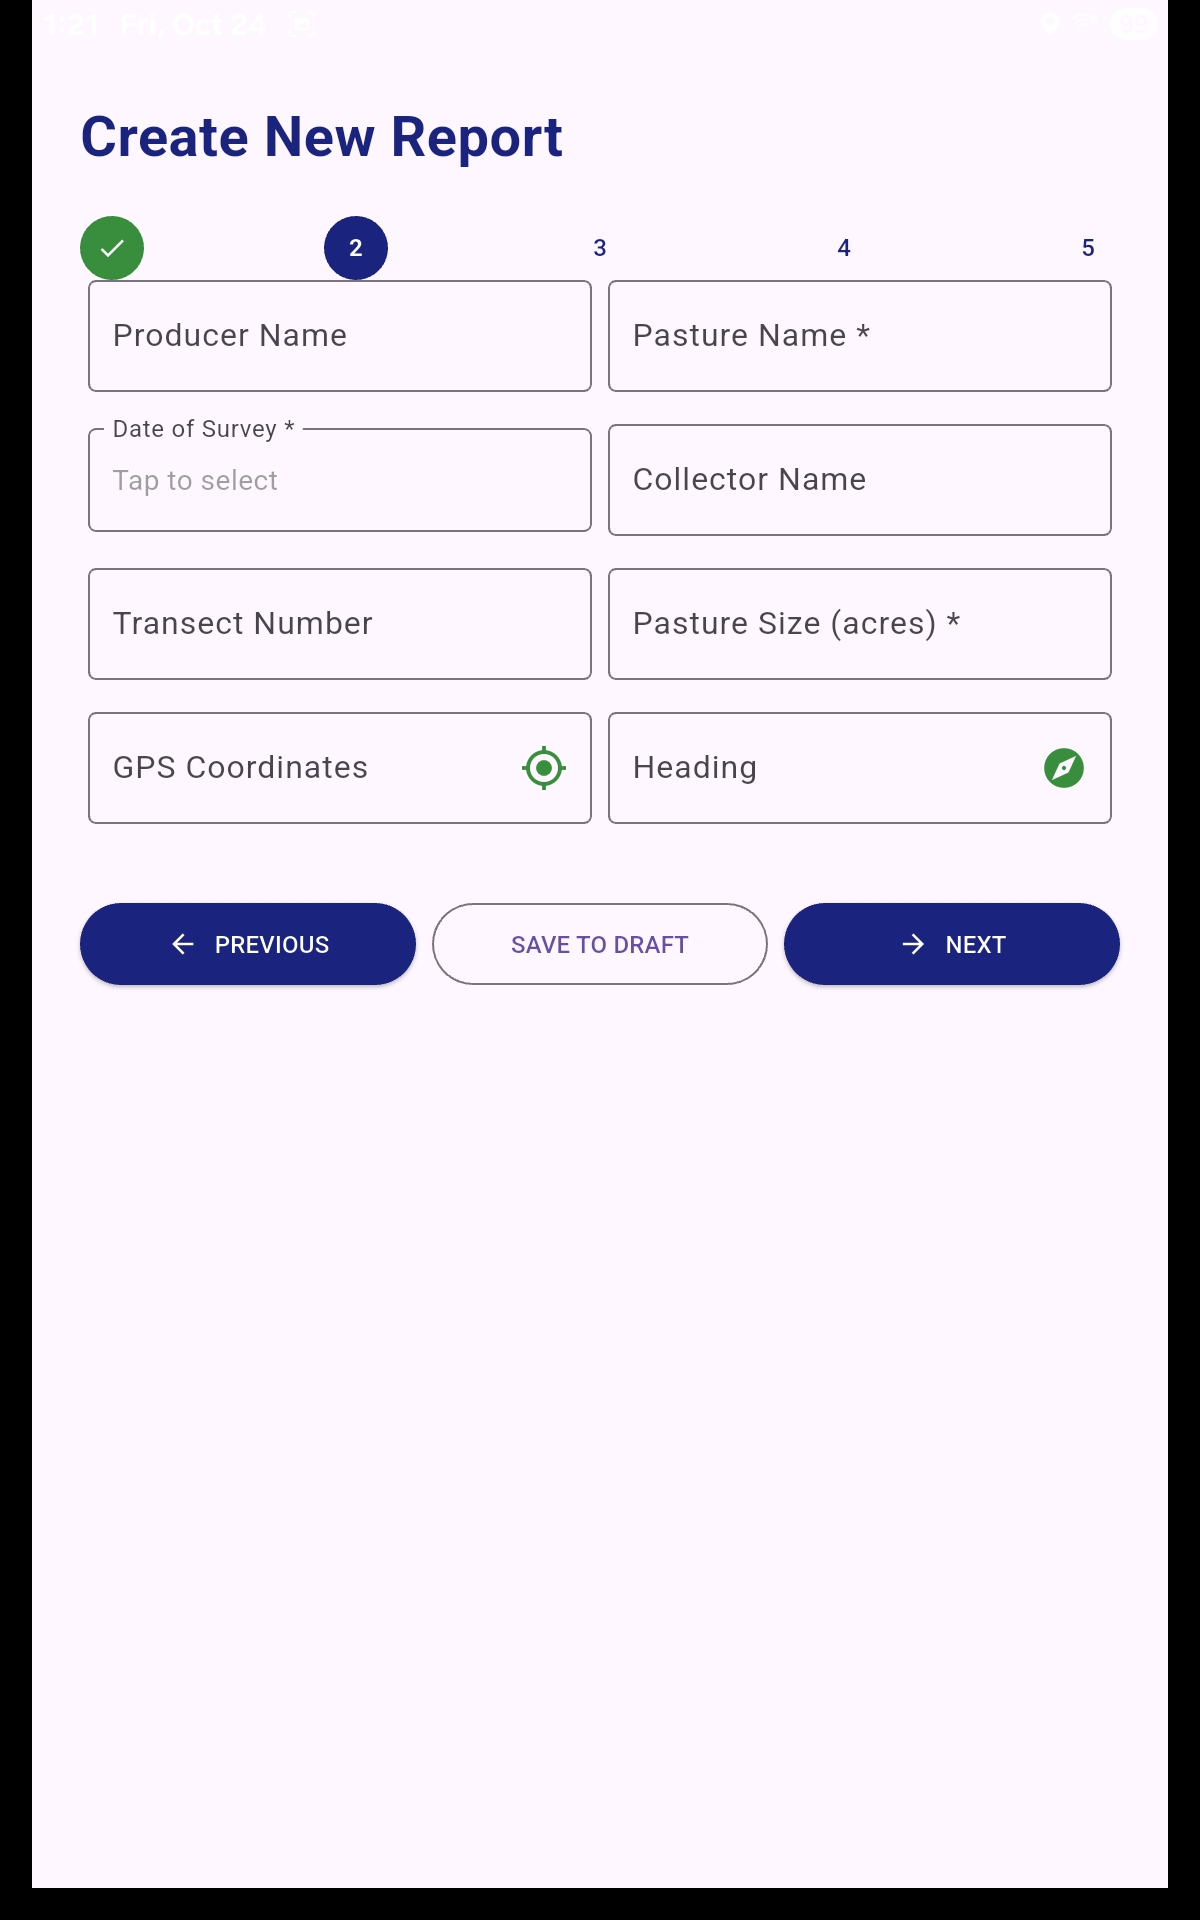
Enter Producer & Pasture Name, Date, Collectors, Transect #, Pasture Size, and Tap 📍 to autofill GPS & Heading.
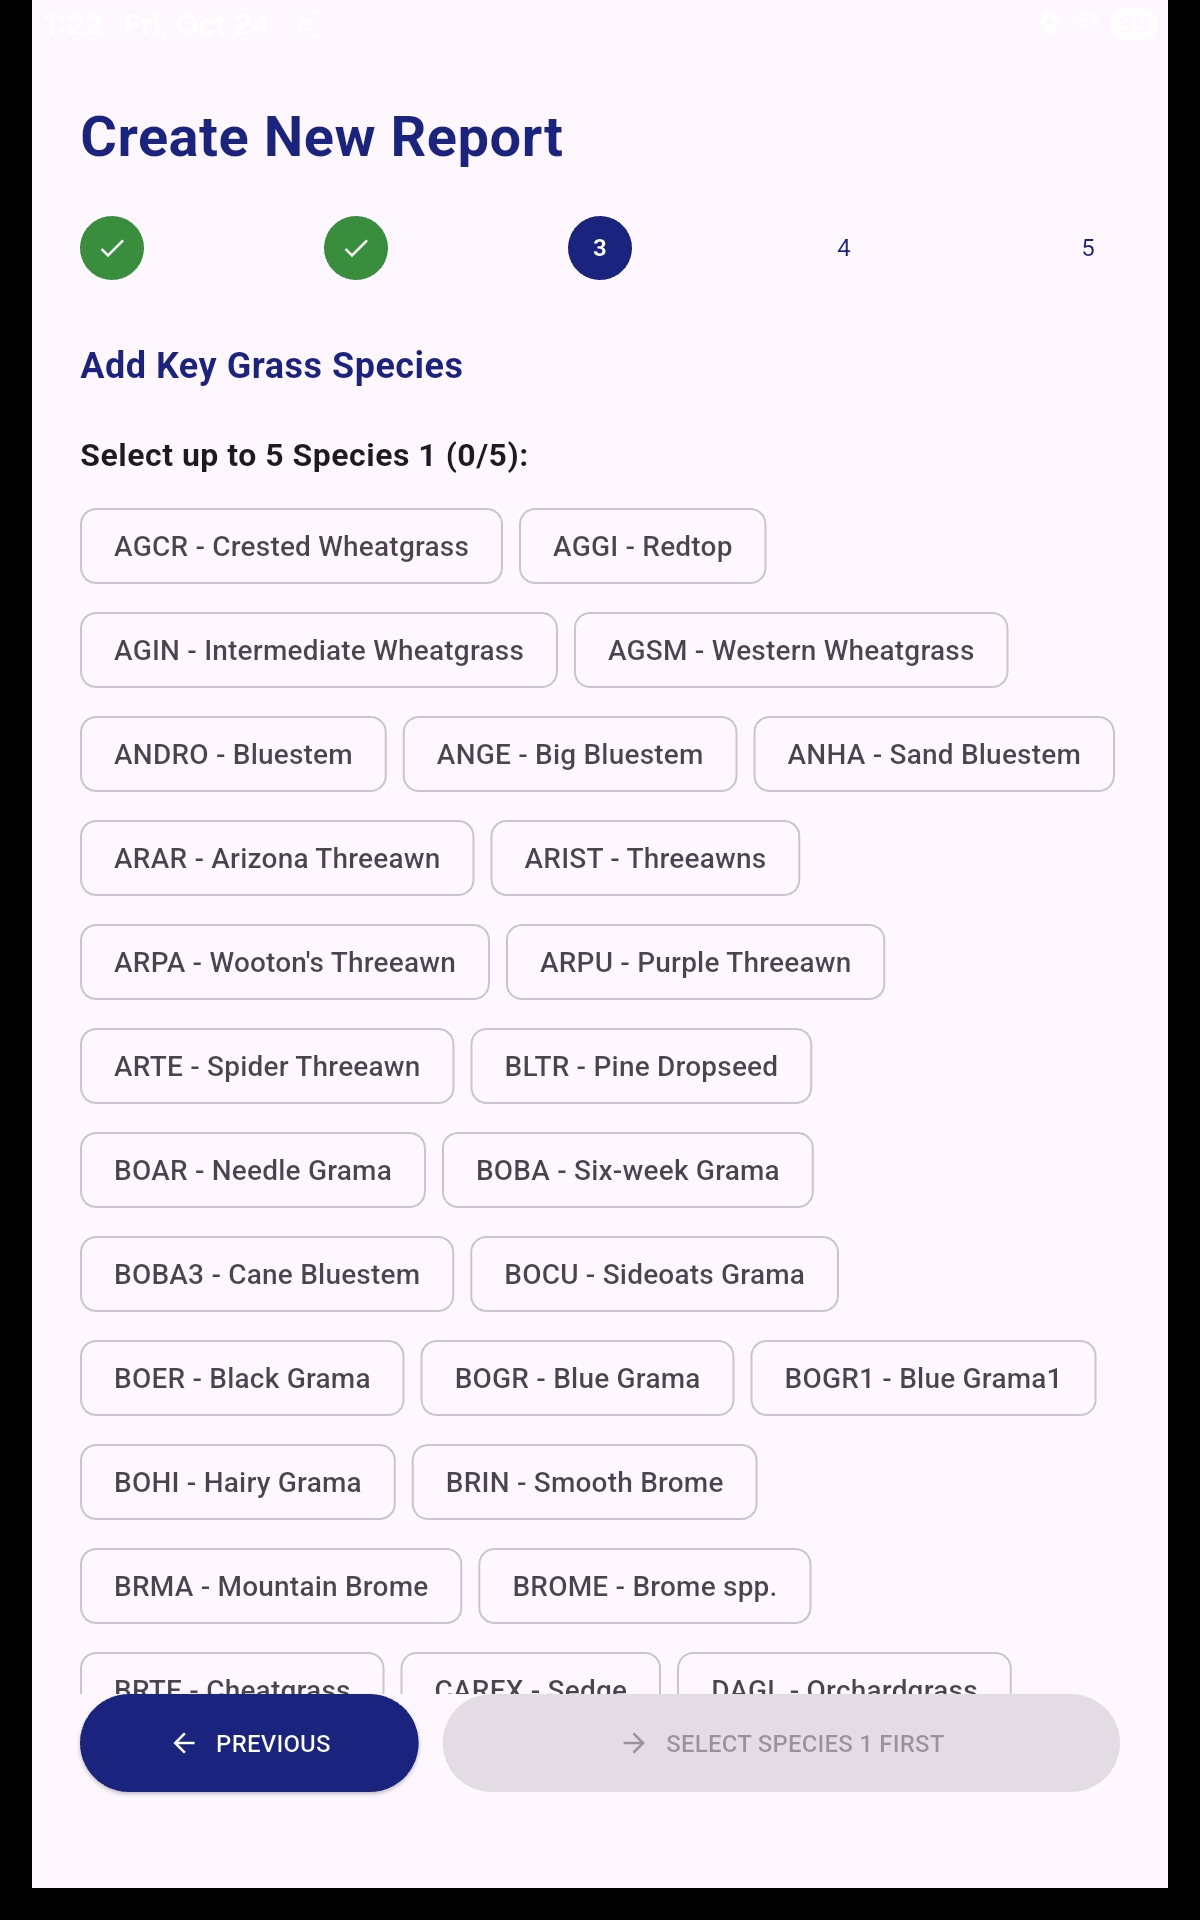
Scan pasture & select top 4 grass species, then select start recording in app.
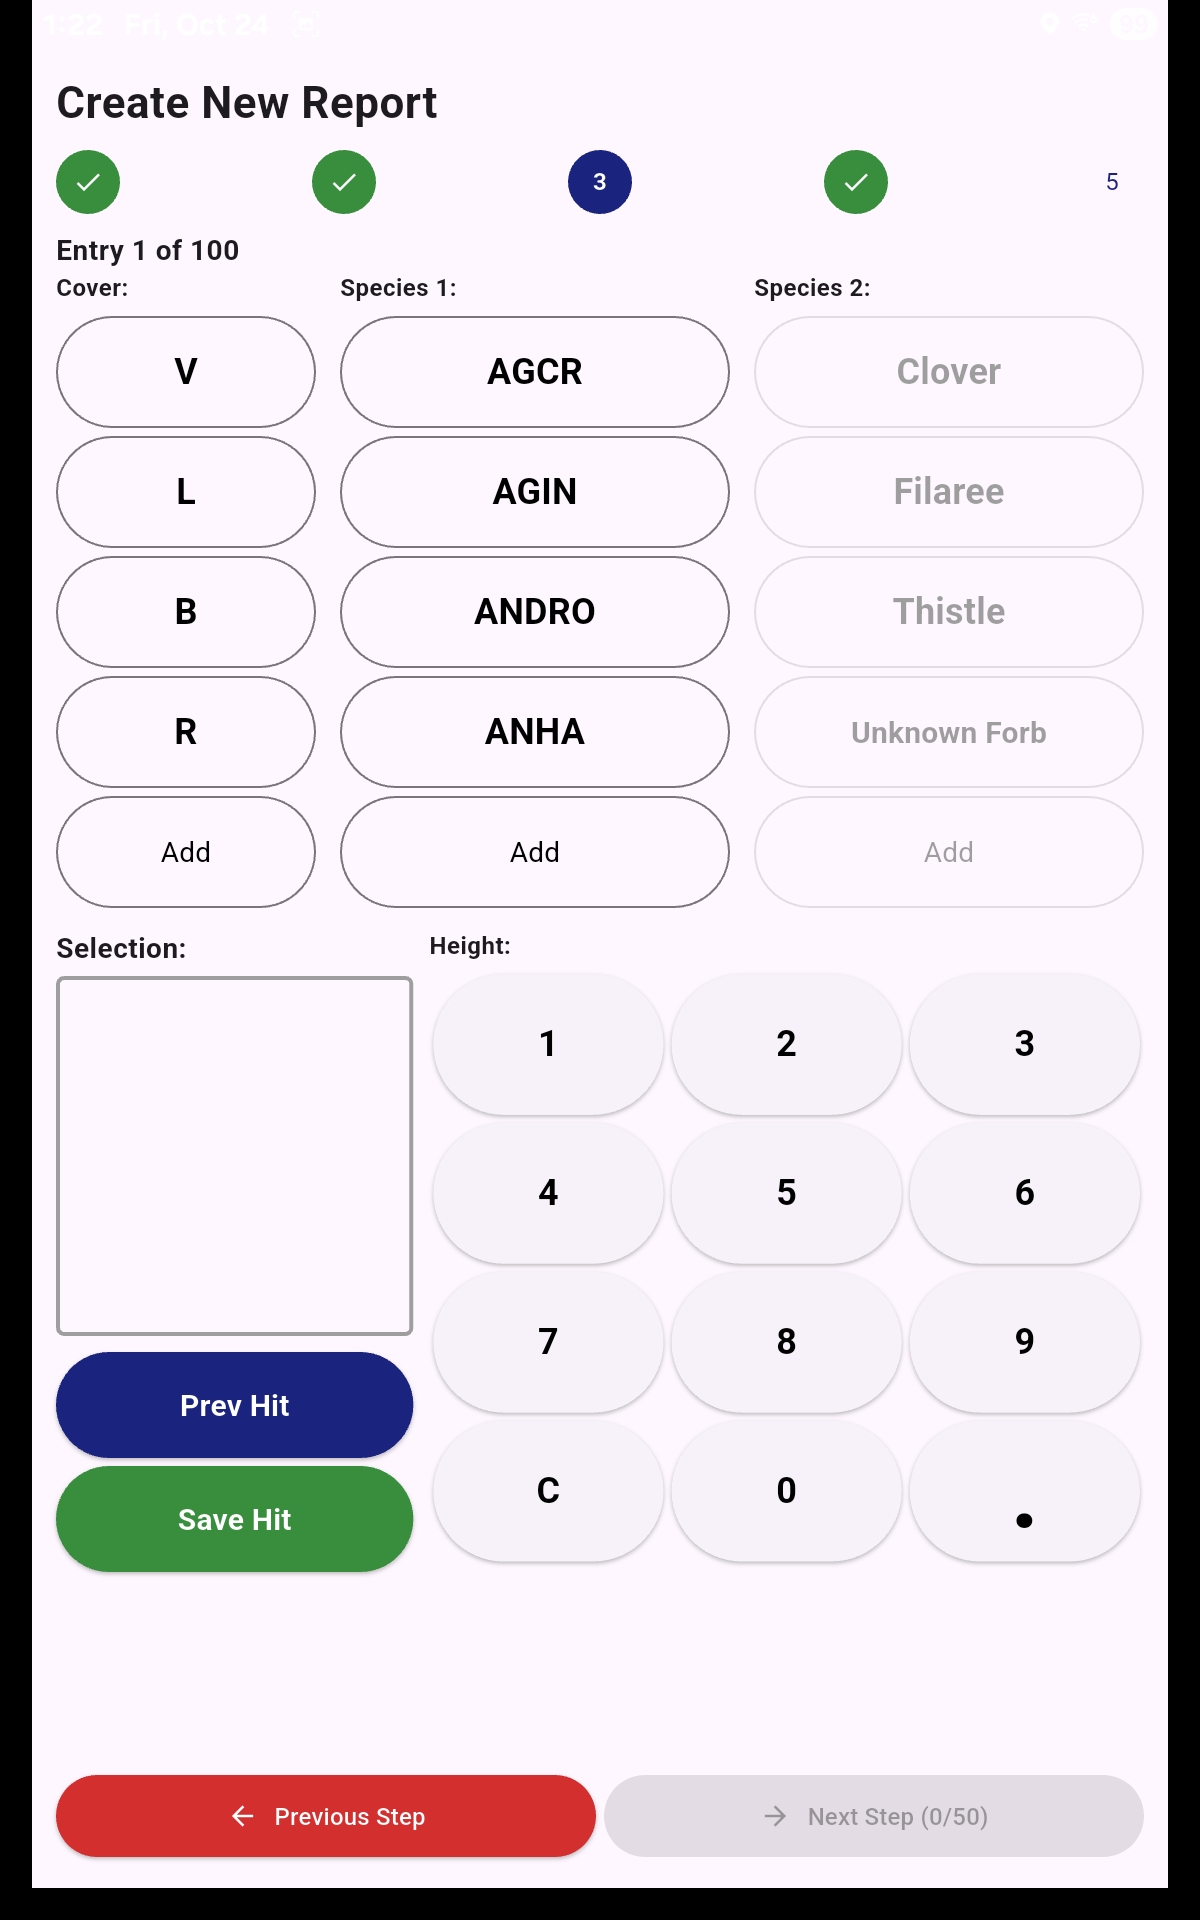
Enter observations (cover, height, species). When ≥50 hits entered, proceed to next step.
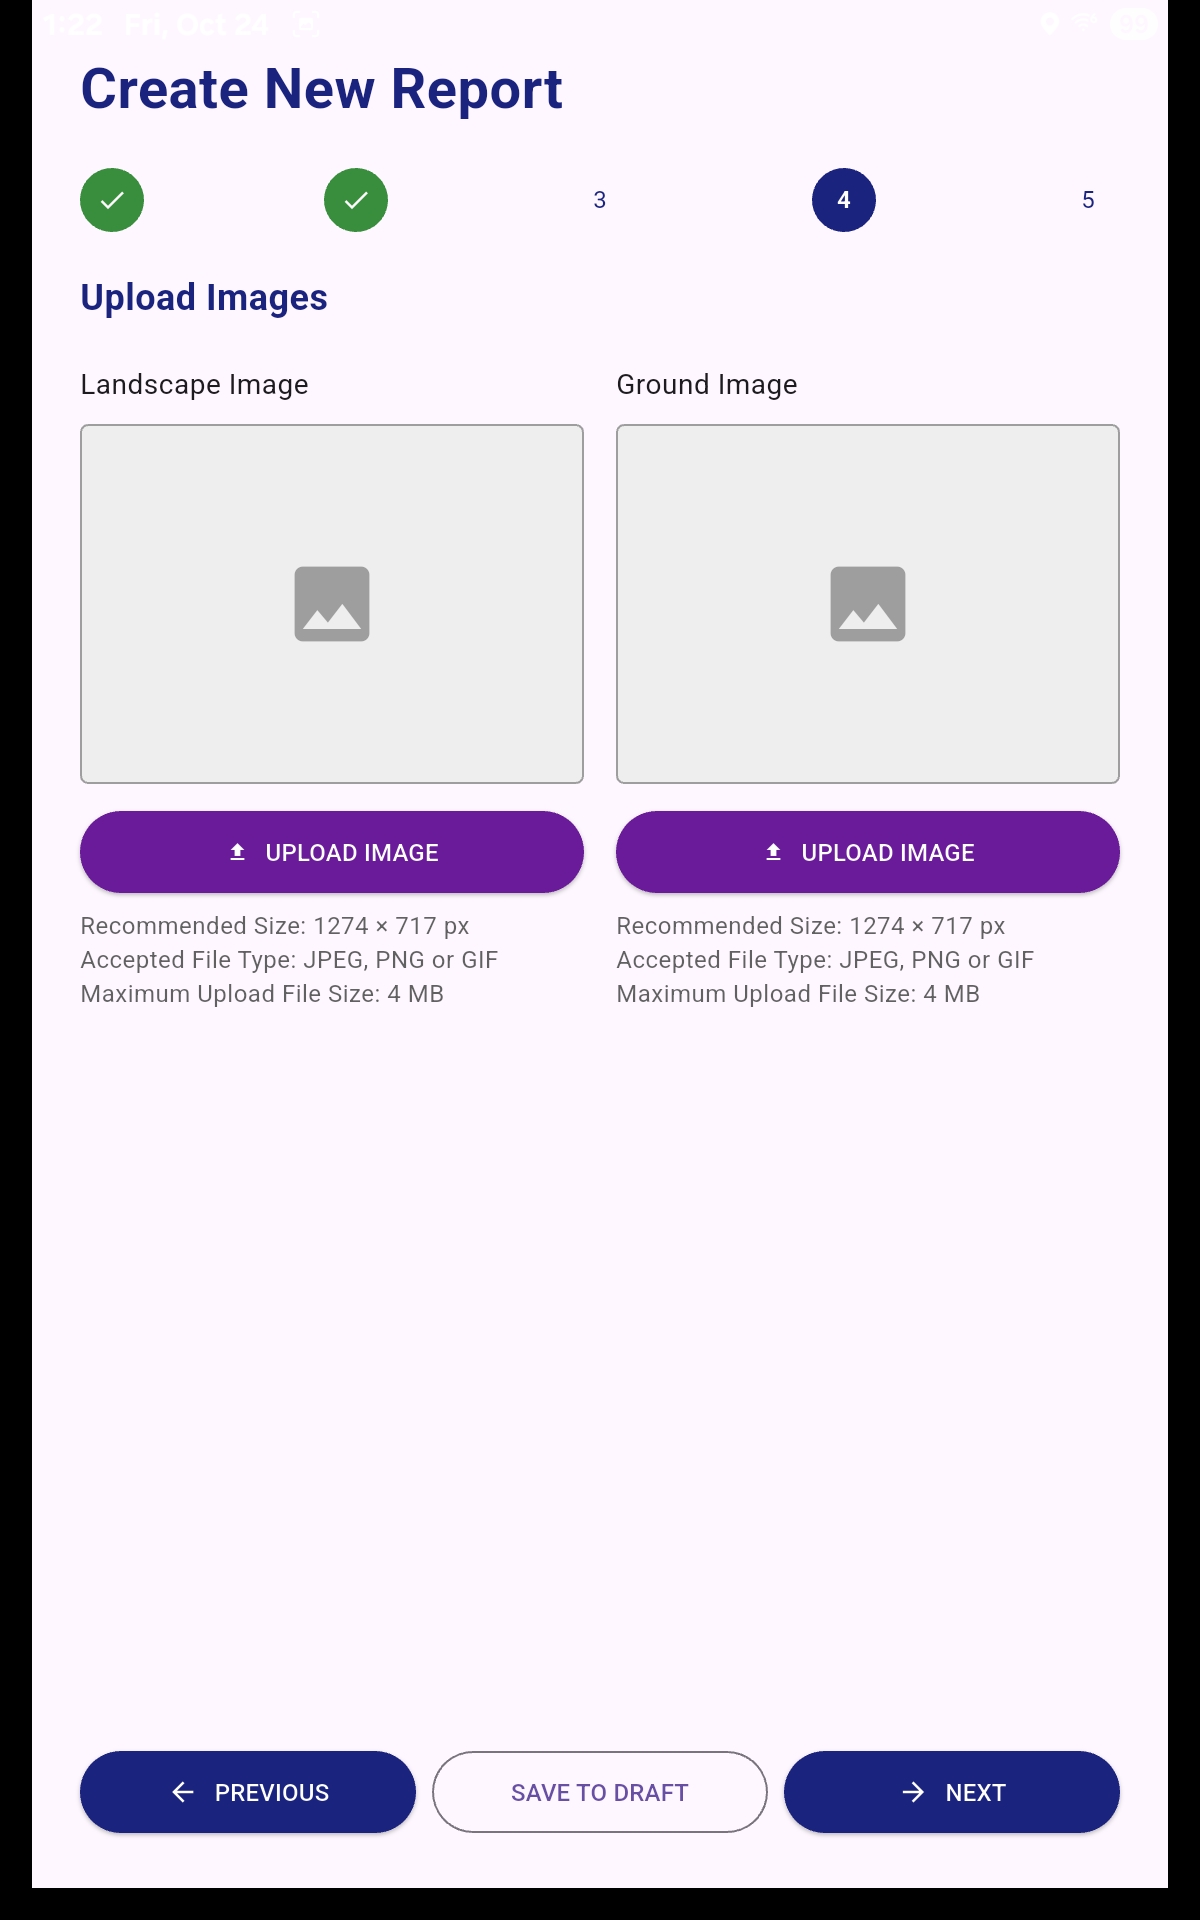
Add landscape + ground photos; crop in-app.
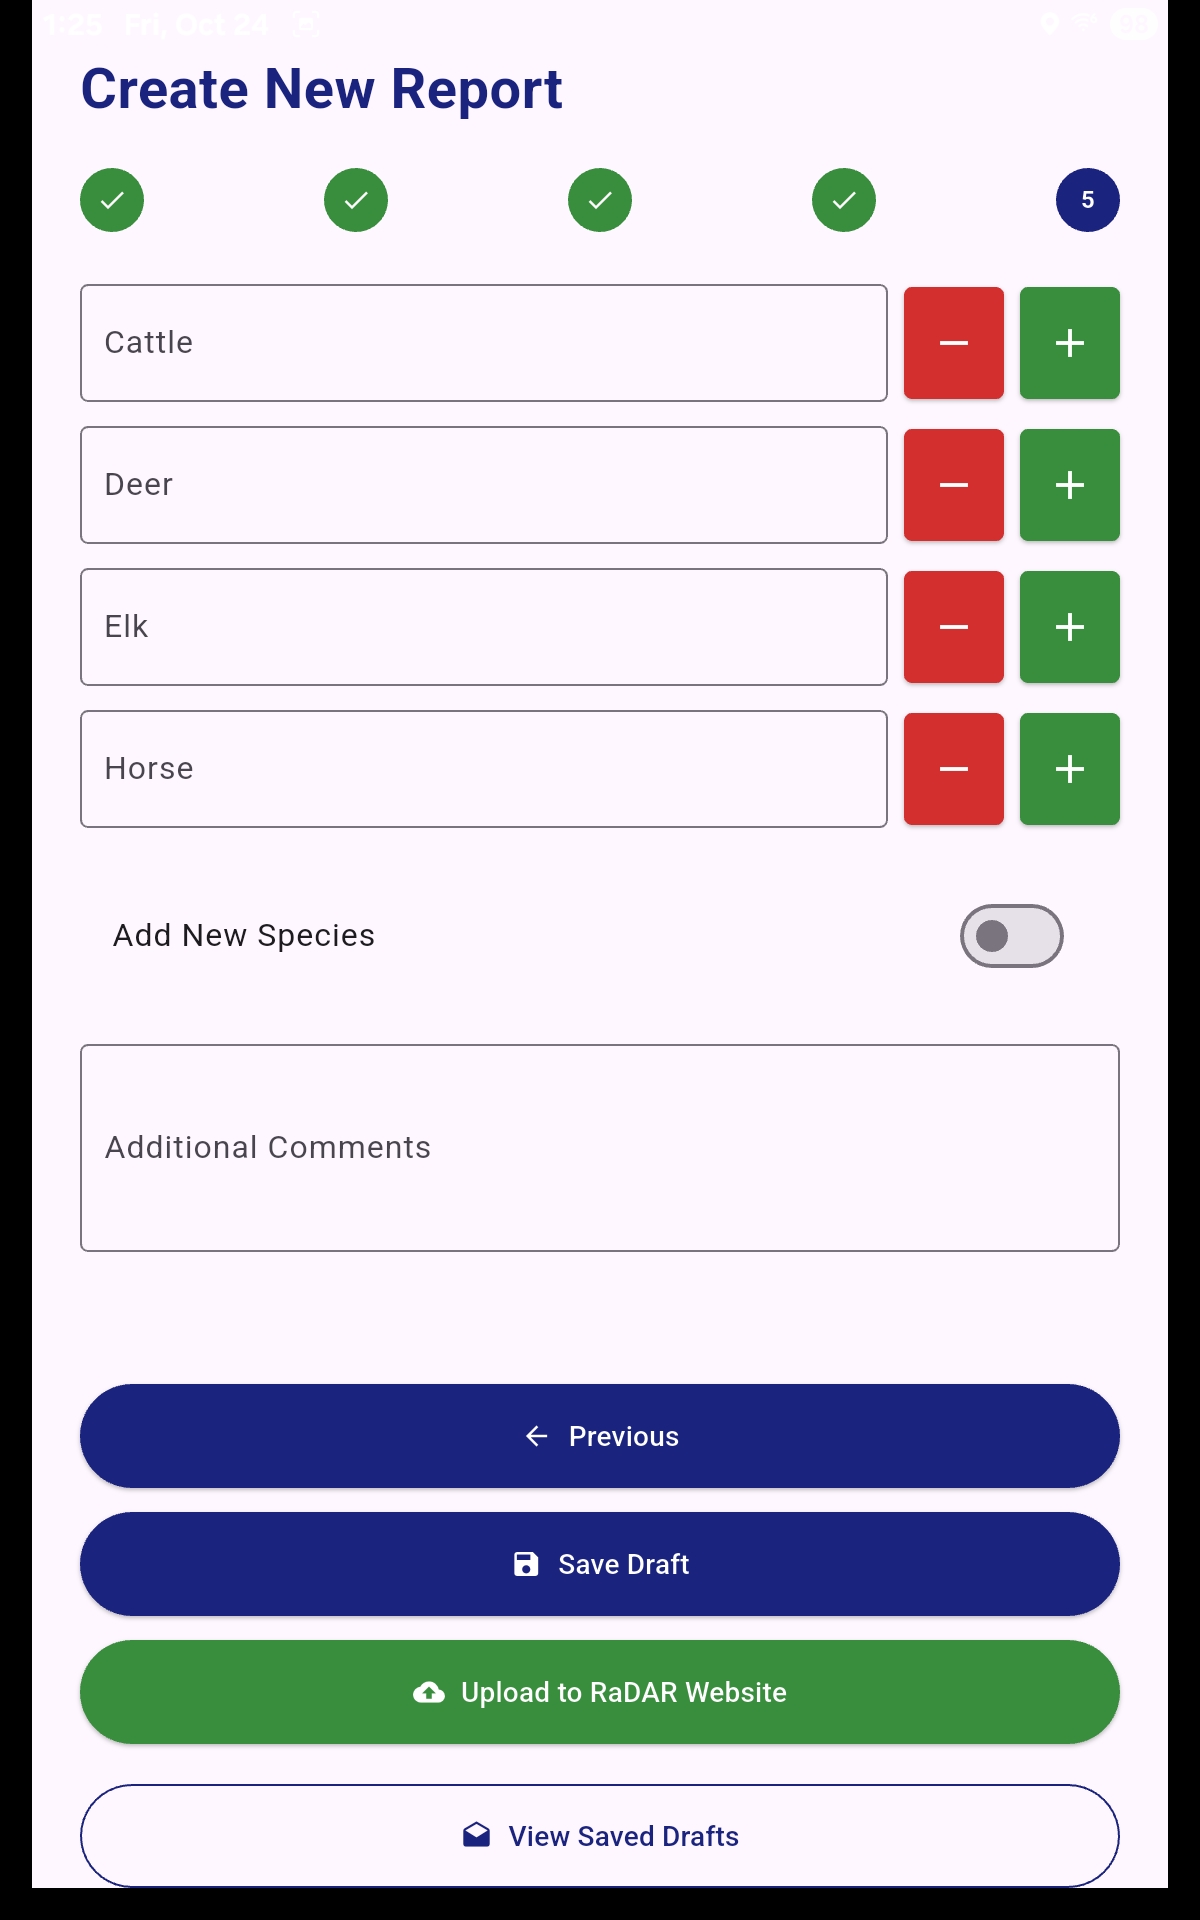
Optional entries: dot tallies, clip weights, comments.
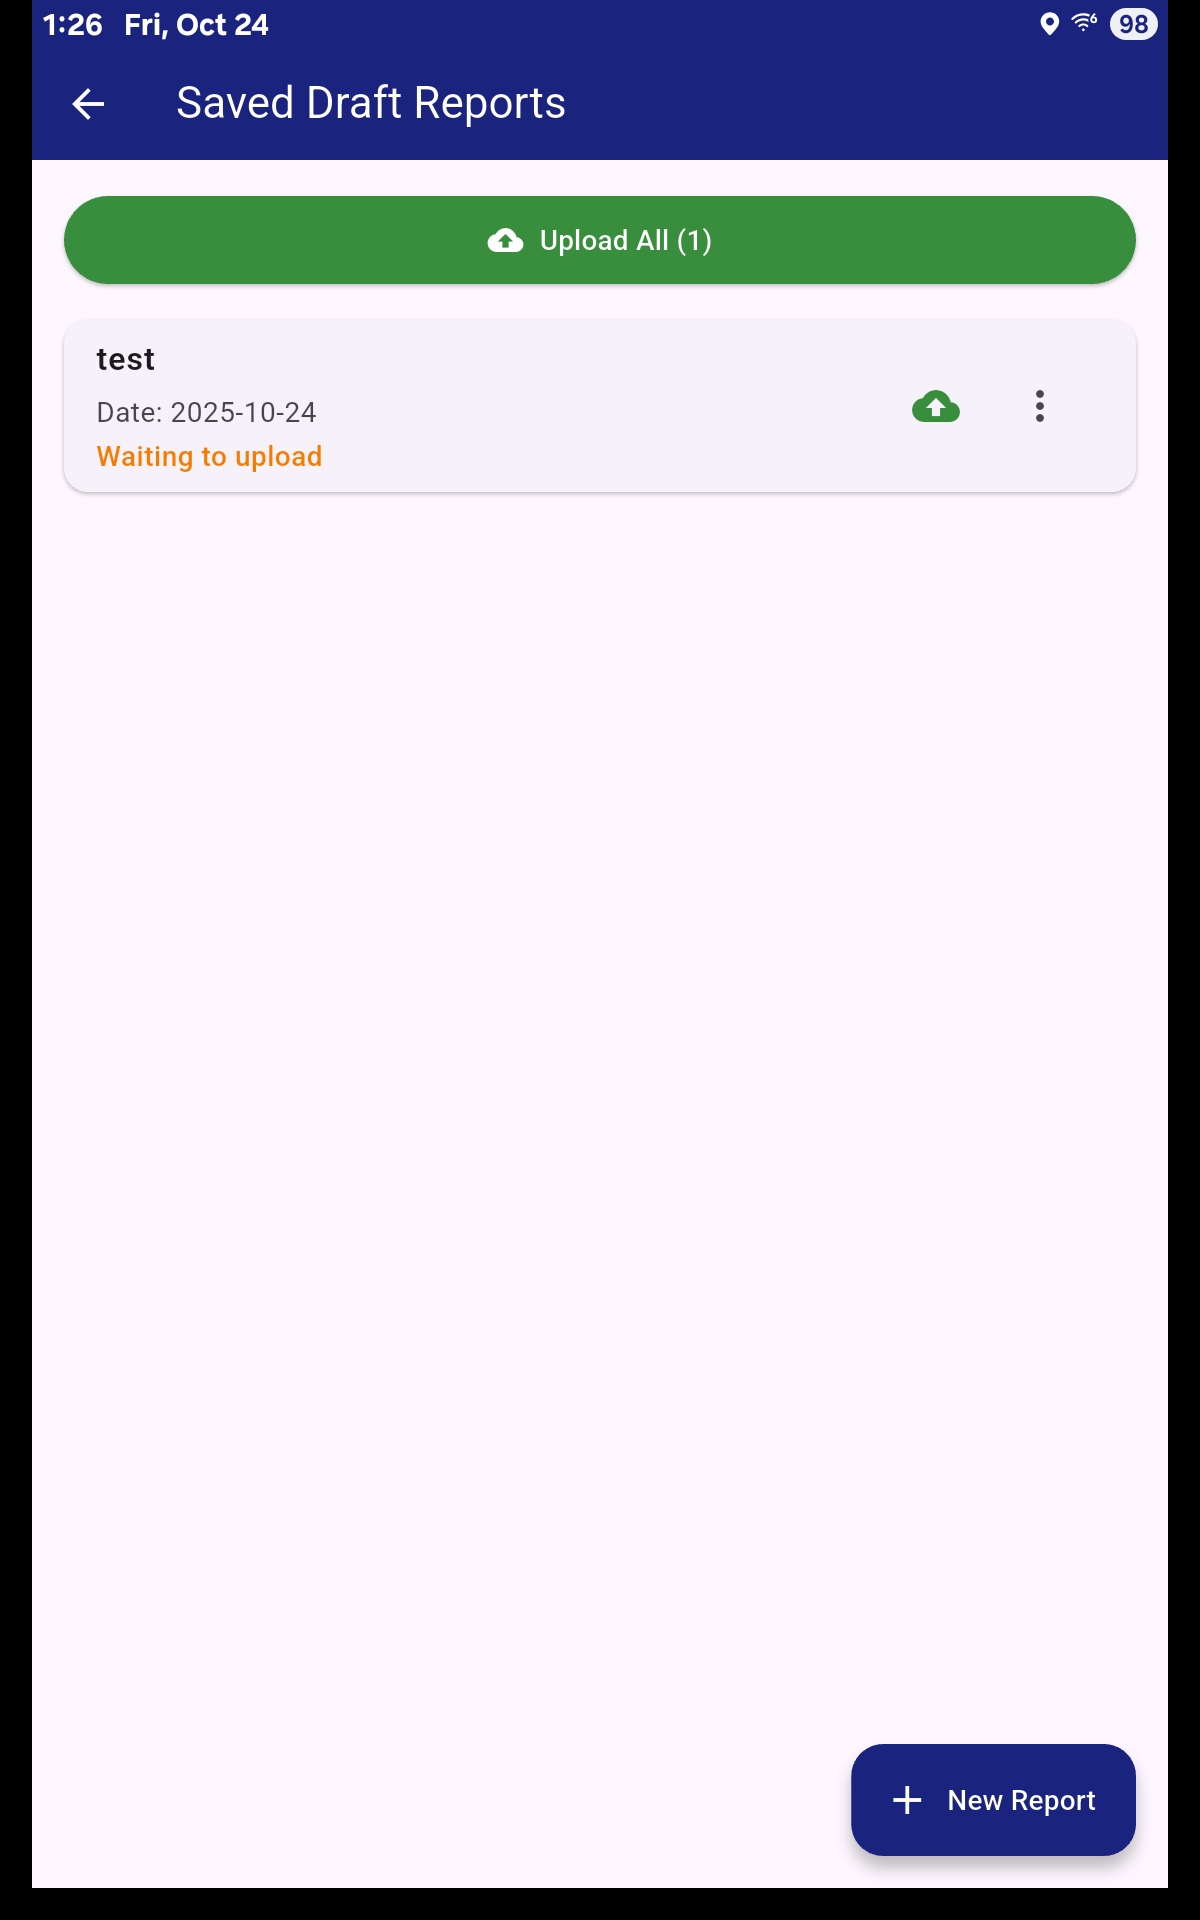
Sync your field data to your web account.
Log into the website to review data and final generated report.
 →
→
Detailed instructions for entering data through the web interface
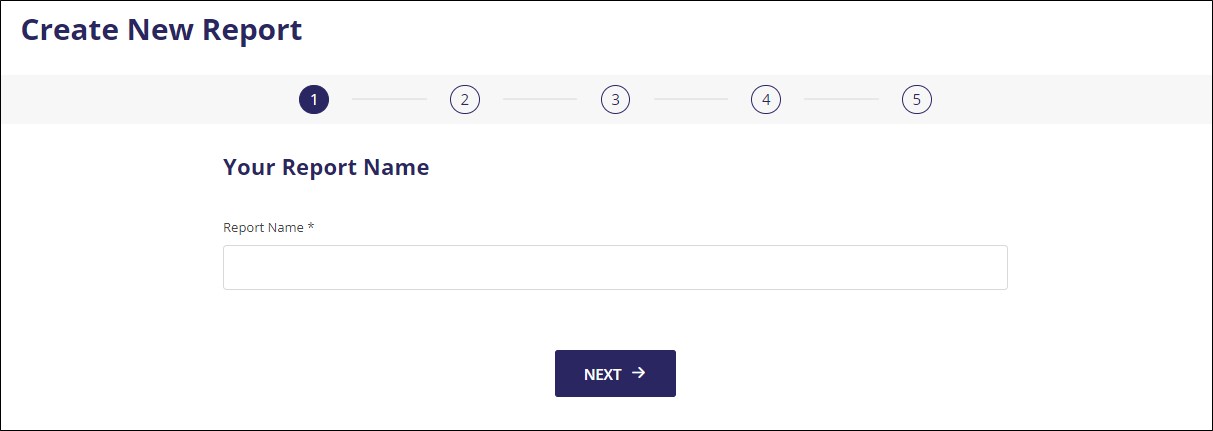
1. Name report.
This will be the first step in creating a report. The name entered will be how the report can be found and reviewed later. All drafts and final reports can be found under the Report Listing Page. Select NEXT to continue with data entry.
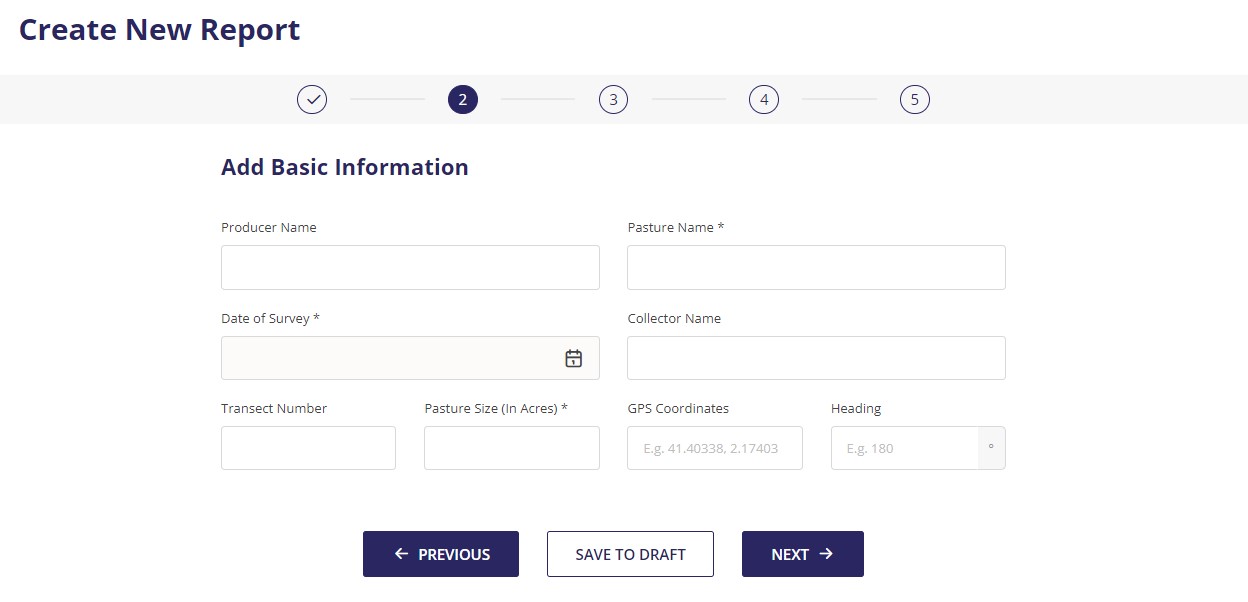
2. Add Basic Information.
This information can be found at the top of Rapid Assessment Methodology (RAM) datasheet.
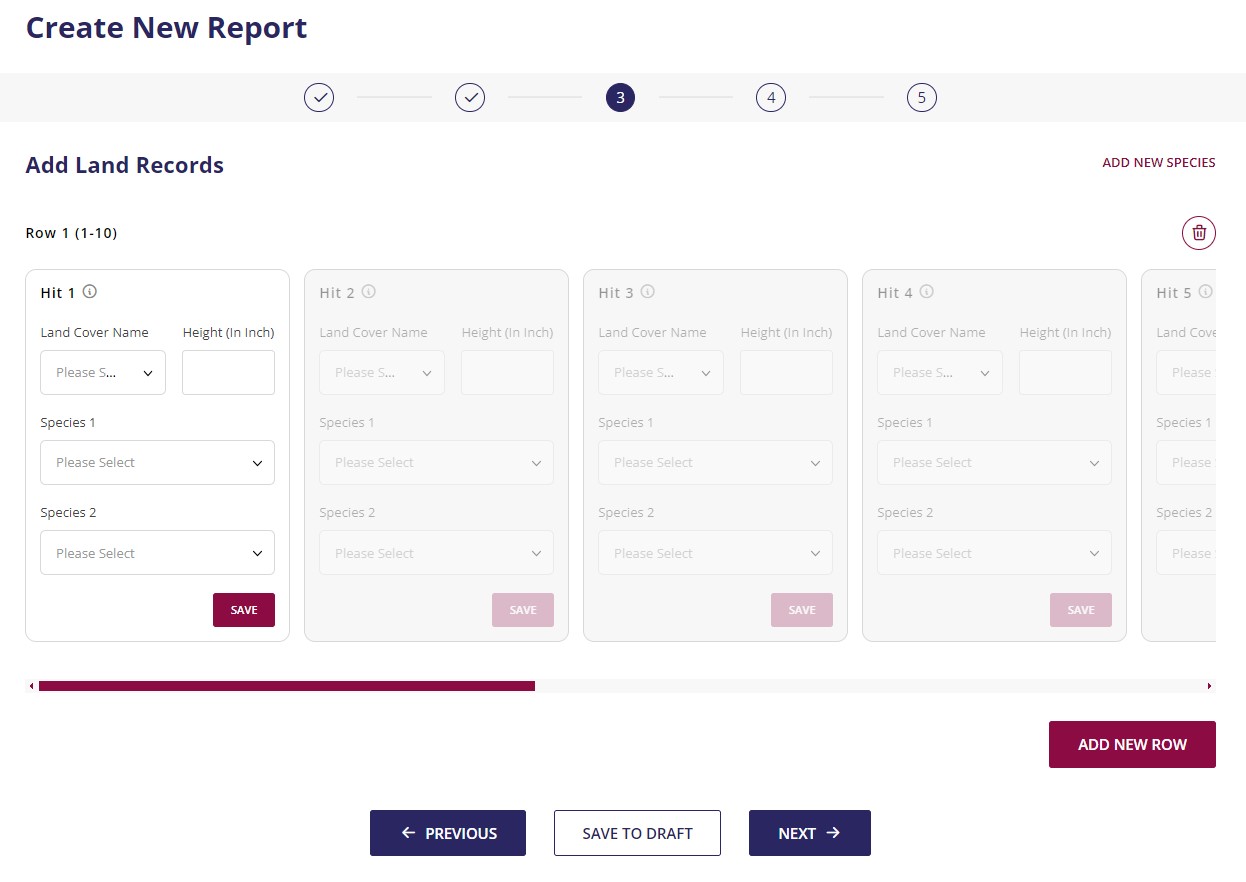
3. Add Land Records.
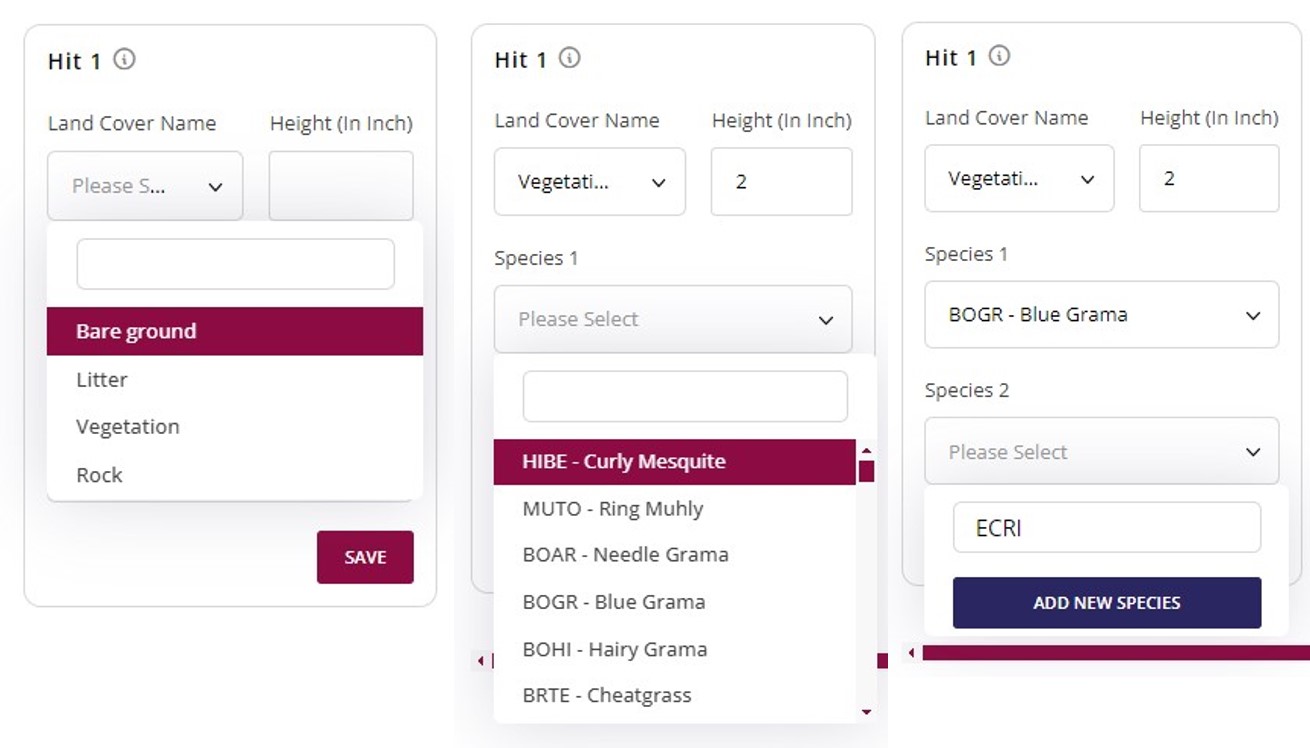
Each assessment reading is called a ‘Hit’. These can be found on the RAM datasheet. Each row contains 10 hits and data entry aligns with the datasheet for 100 readings or Hits. The first box is Land Cover Name, the second is Height (in Inches), the third is forage species (Species 1 for entry; grasses only), and the fourth is other species (Species 2 for entry).
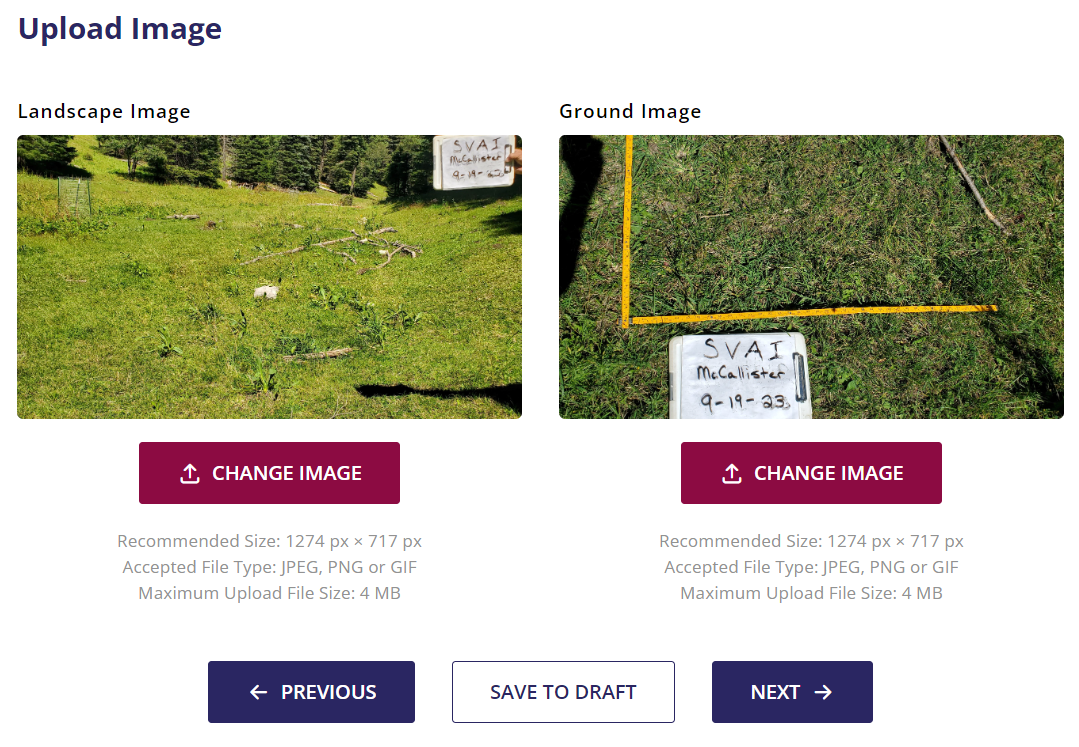
4. Upload Image.
Both a landscape and ground level photo is required. A landscape photo is a picture taken down the length of the transect, while a ground photo is taken from above looking down. These photos help to corroborate the transect data and are an excellent visual representation of changes over time. Photos must be less than 4 MB in size and in a JPEG, PNG, or GIF format. Once uploaded, you can resize the image for the report. Once completed, select NEXT to continue.
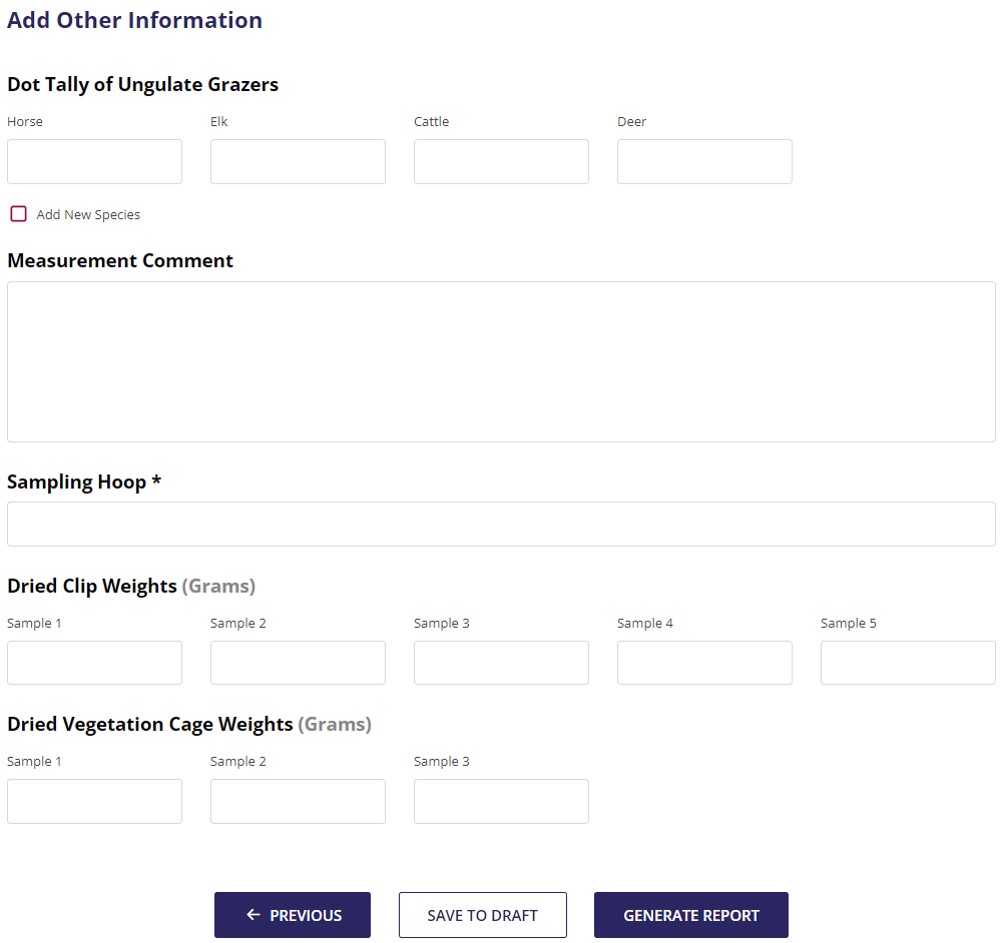
5. Add Other Information.
Additional assessments such as Dot Tallies or fecal counts, and Comments can be added to supplement the report. From the protocols in RAM (hyperlink to Monitoring Procedures Page), vegetation clips need to occur along the transect and within cages. A known hoop or quadrant size (hyperlink to Table 1 of procedures page) is required to calculate forage production. To enter dried clip and cage weights in grams refer to the RAM protocols. Once the required information is entered, select SAVE TO DRAFT or GENERATE REPORT.
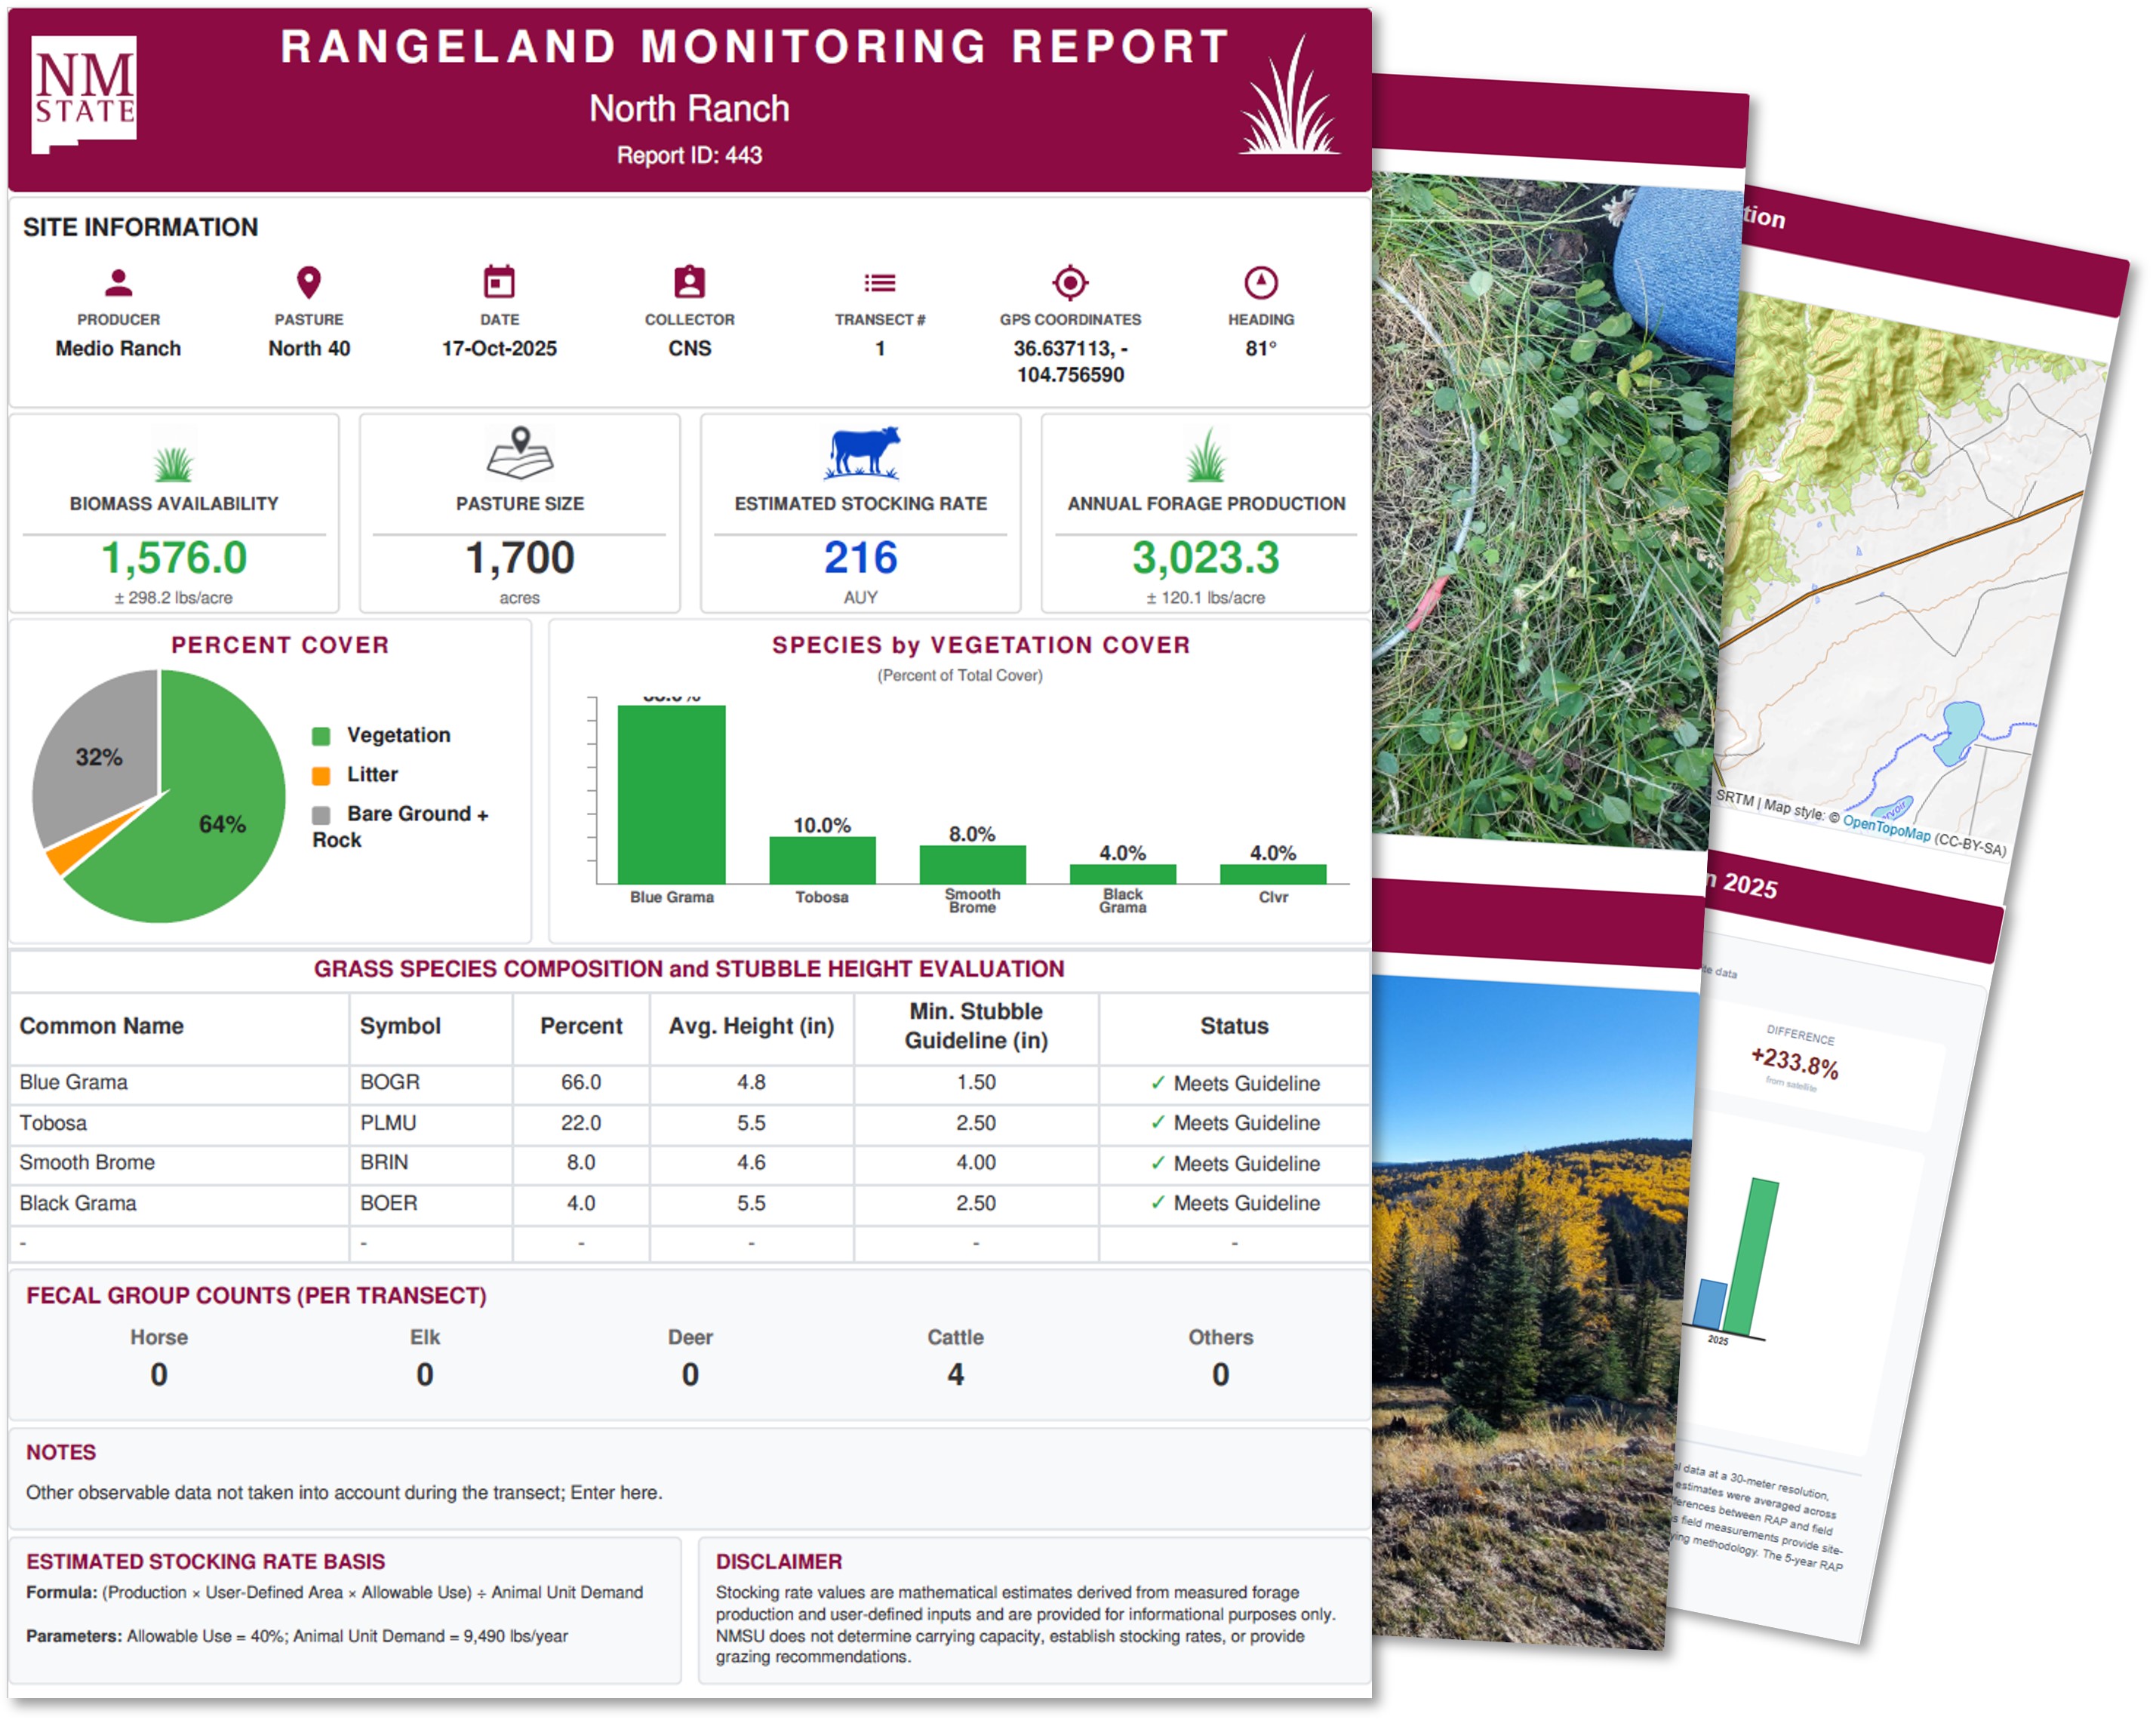
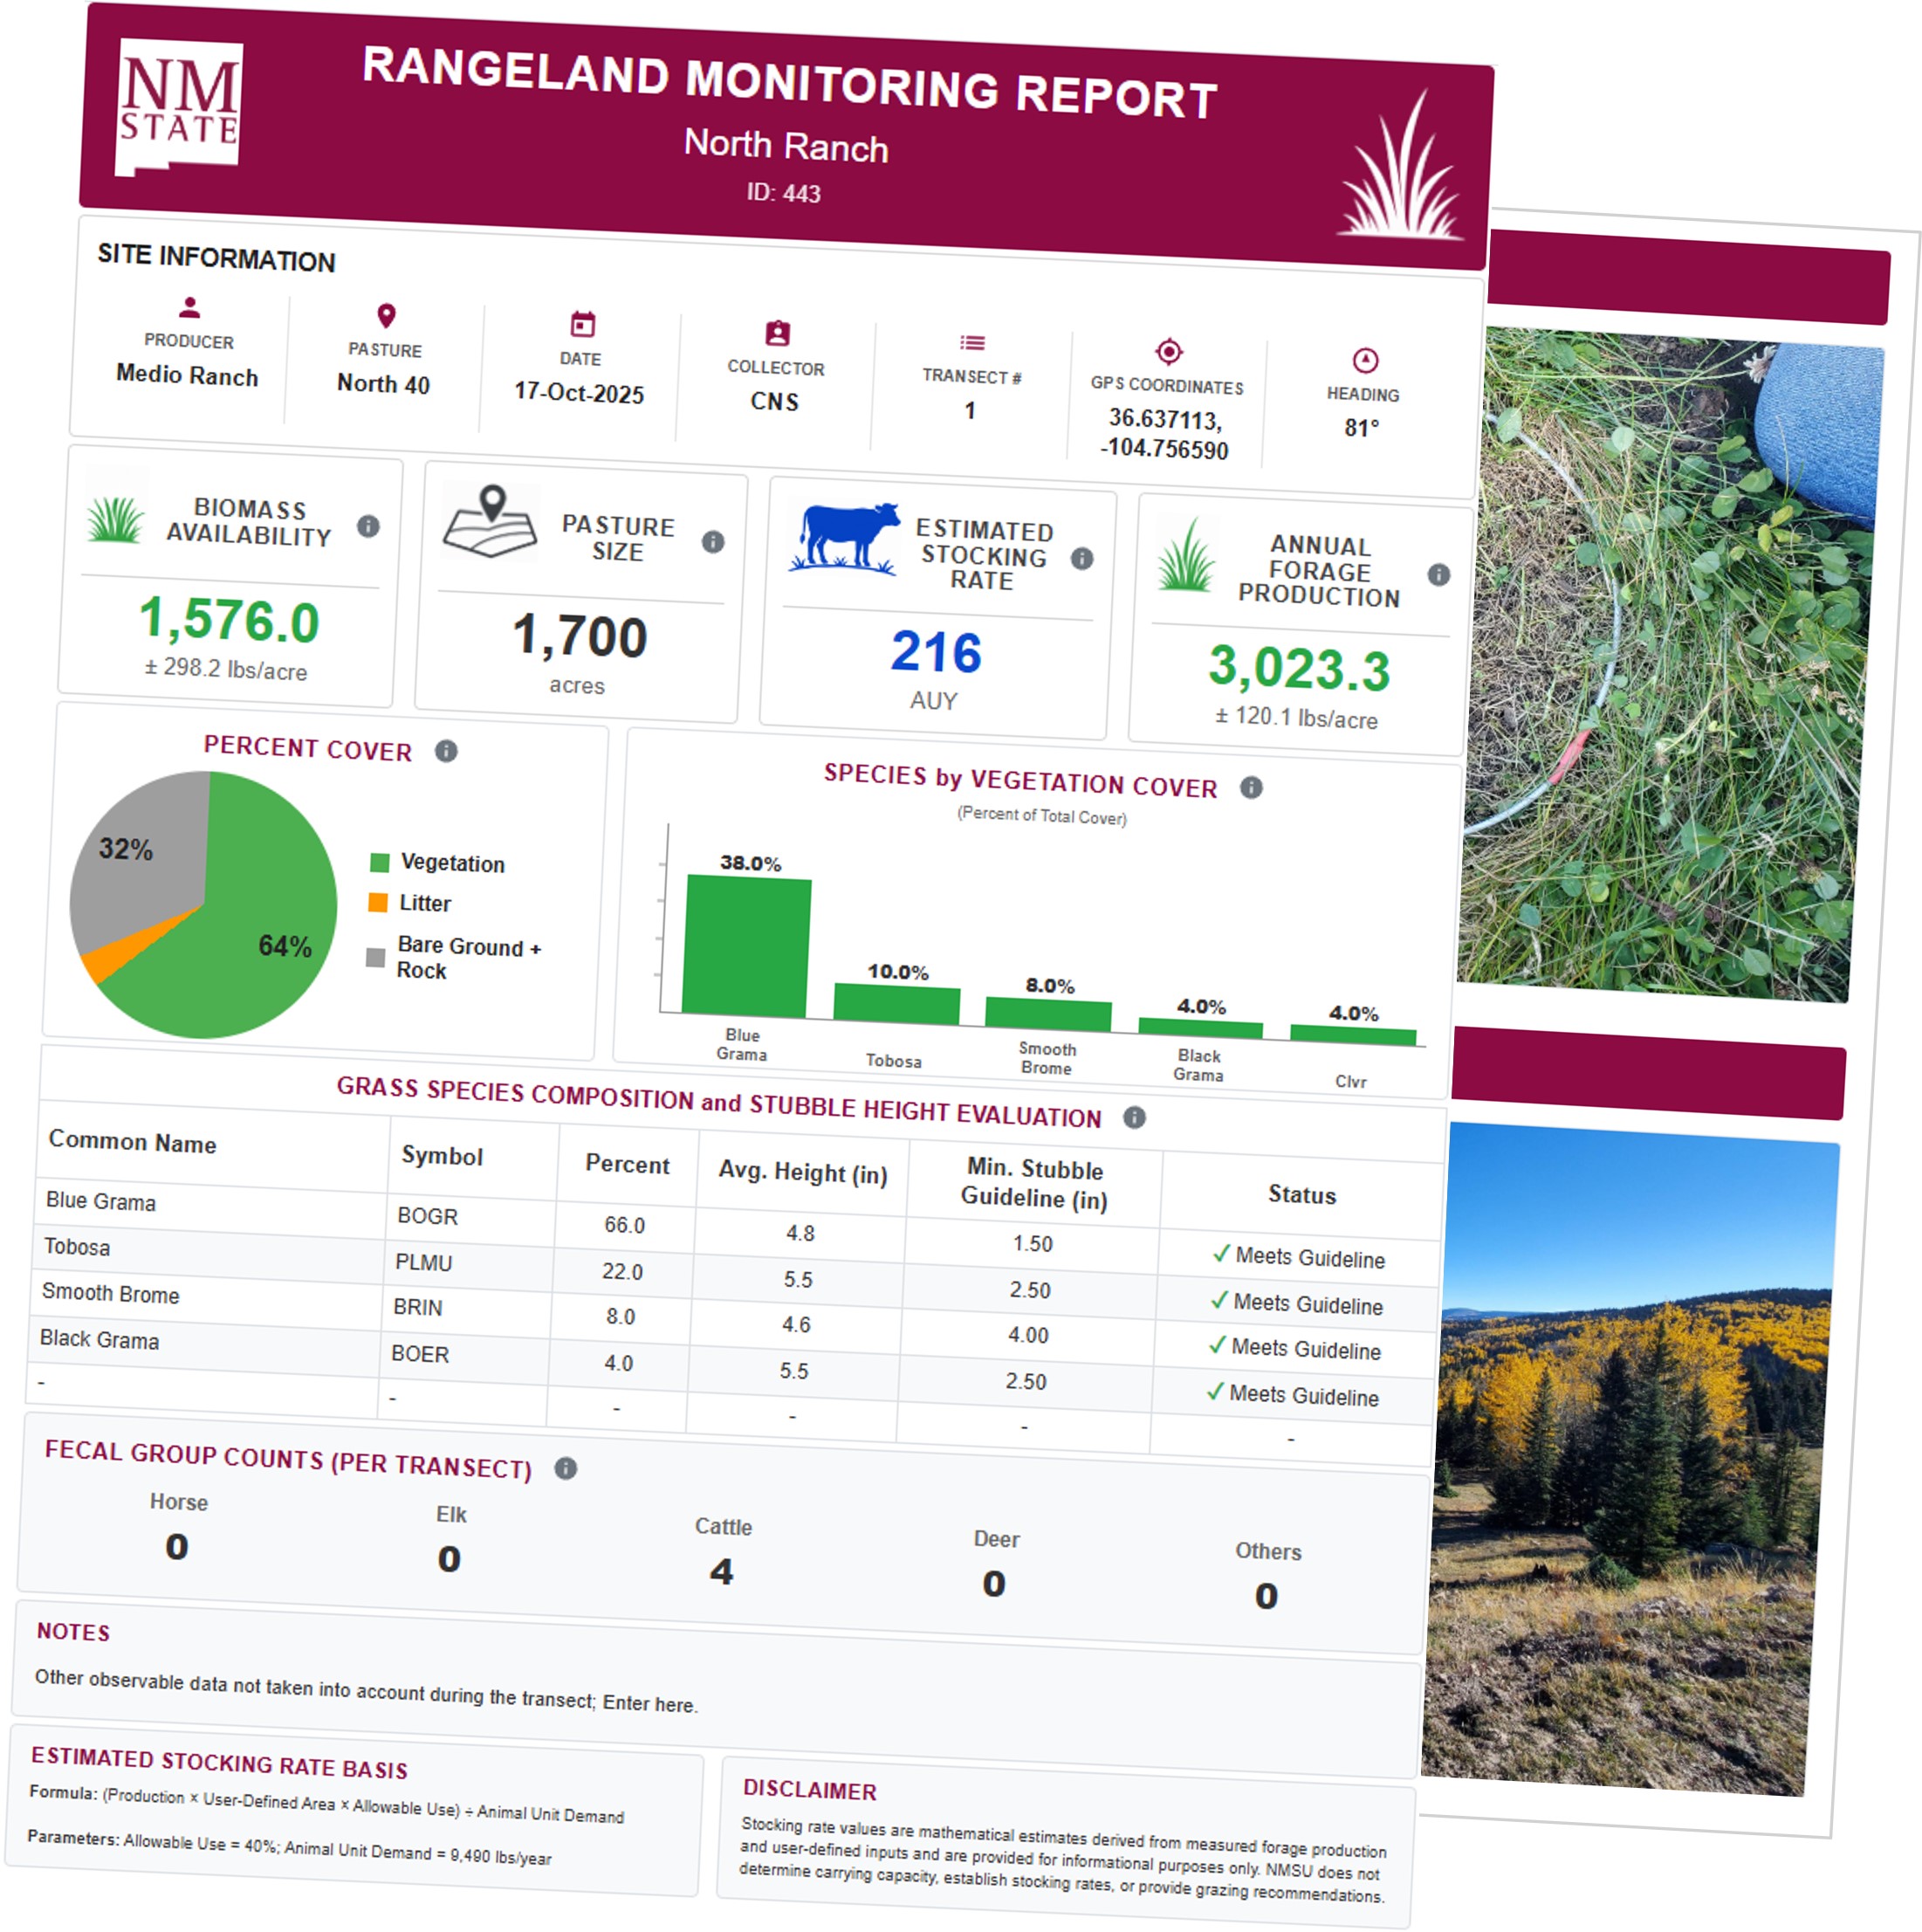
Congratulations! A report has been created for you. You can view or download your report immediately by selecting ‘View Report’ or ‘Download PDF’, or select GO TO MY REPORTS to view all other reports that have been created on the account. An example of the report can be found below.
Understand what the report means here